Getting Started
Launching
Launch from your application menu or run:
ctfl
CTFL starts as a system tray icon.
Basic interactions
- Left-click the tray icon to toggle the usage popup
- Right-click for the context menu (refresh, settings, check for updates, quit)
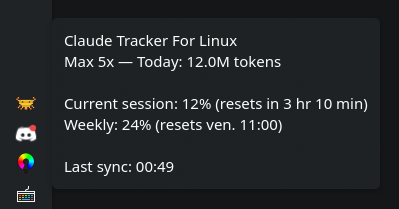
- Hover over the icon to see a quick summary in the tooltip
Usage popup
The popup shows your token usage in several views:
- Daily — bar chart of tokens per day
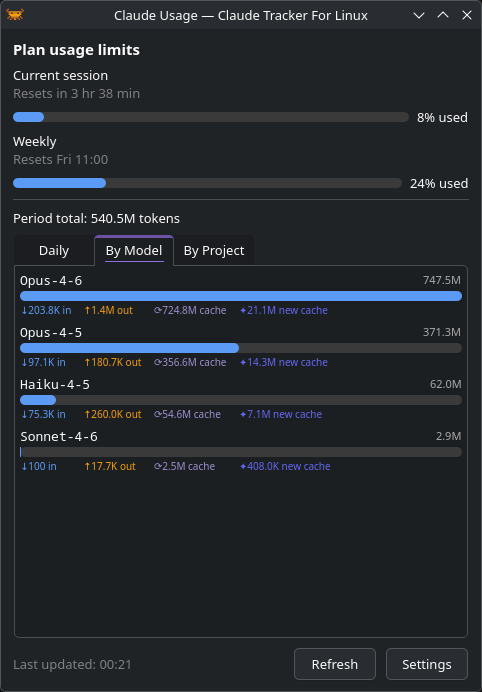
- Models — breakdown by Claude model
- Projects — breakdown by working directory
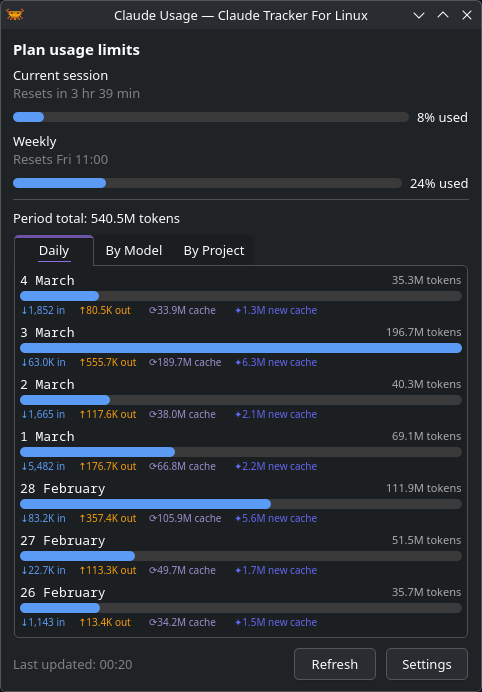
Long lists scroll inside the tab instead of stretching the popup off-screen, so raising Days to show in Settings is safe.
Above the charts, the popup surfaces plan rate-limit bars fetched from claude.ai. Pro and Max plans show a session (5-hour) bar and one bar per weekly bucket — currently All models, Sonnet, and Claude Design — each with its own reset timestamp. Enterprise plans show a monthly spend bar with used / cap credits instead. The same figures appear in the tooltip when it is enabled.
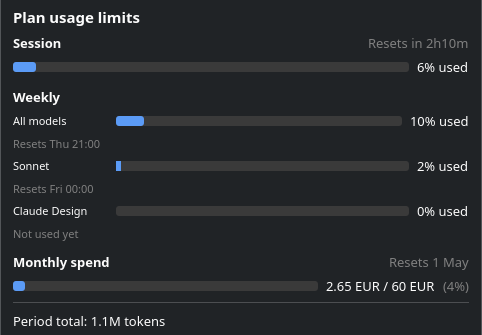
Buckets you haven't used yet (for example, Claude Design before first use) show Not used yet in place of a reset time, and are omitted from the compact tray tooltip.
Long-context usage hint
When recent activity is dominated by large conversations, the popup surfaces a hint under the period total, for example:
Recent sessions: 61% of tokens used at >150k context ·
/compactmid-task,/clearbetween tasks
Each message you send to Claude re-includes the whole conversation. Once the context passes ~150k tokens, each further reply is much more expensive — even with prompt caching. If you see this hint, running /compact mid-task or /clear when switching to unrelated work significantly reduces rate-limit burn.
The hint is computed over recent (JSONL-logged) sessions, not the full displayed period — older data aggregated by Claude Code's stats cache doesn't include per-message context size, so only the recent window can be measured.
Next steps
- Configure data sources to choose where CTFL reads usage data
- Customize settings to tailor the app to your workflow