Data Sources
CTFL can read usage data from multiple sources. Configure this in Settings → Usage Data Source.
Local logs
Reads Claude Code conversation files from ~/.claude/projects/. This is the default — no API key needed.
Provides:
- Token counts (input/output) per conversation
- Per-project and per-model breakdowns
- Cost estimates (optional, based on public pricing)
Multi-account setups (CCS)
If you use CCS to juggle several Claude accounts, CTFL discovers each instance under ~/.ccs/instances/*/ alongside the legacy ~/.claude/ directory and lets you switch between them.
By default CTFL auto-detects the active profile:
- Scans running
claudeprocesses forCLAUDE_CONFIG_DIR— so whichever profile you just launched wins. - Falls back to the instance with the most recent JSONL activity when no session is running.
You can also pin a specific profile via the tray menu (Right-click → Profile). See Configuration → Profile.
Admin API
Fetches organization-level usage from the Anthropic Admin API. Requires an admin API key.
Provides:
- Accurate token counts and costs from Anthropic's billing data
- Organization-wide usage (not just local conversations)
To set up:
- Go to Settings → Admin API Key
- Enter your Anthropic Admin API key
- Set data source to Admin API or Both
Both
Merges data from local logs and the Admin API. Use this to get the most complete picture — local project breakdowns combined with accurate API billing data.
OAuth / Rate limits
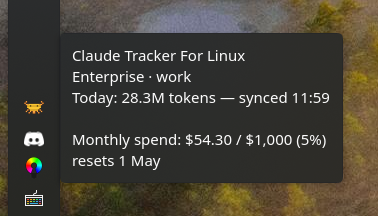
CTFL reads your Claude Code OAuth credentials (.credentials.json inside the active profile directory) to fetch plan utilization directly from claude.ai. Pro and Max plans expose a session (5-hour) window and multiple weekly windows (All models, Sonnet, Claude Design), each with its own reset time; Enterprise plans expose a monthly spend window instead, shown as used / cap credits.
This happens automatically if you're logged into Claude Code — no configuration needed. Token refresh is handled transparently. When you switch profiles, CTFL re-reads credentials from the newly selected instance, so the utilization you see always matches the account you're currently using.
The rate limit data appears in:
- The tooltip (if enabled)
- The usage popup's rate limits section
- Desktop notifications when utilization exceeds the configured threshold